Layer Selection in VLMs for Zero-Shot
OOD Detection
via Multi-Resolution Entropy Estimation
xAILab Bamberg

We perform a systematic layer-wise analysis of zero-shot OOD detection across medical imaging datasets. The optimal representational depth is modality-dependent: texture-driven shifts in histopathology are primarily captured in earlier layers, whereas semantic and anatomical shifts in brain MRI benefit from the global contextual representations encoded in deeper layers. In both cases, the final layer does not deliver the best performance motivating intermediate-layer selection rather than reliance on the last representation.
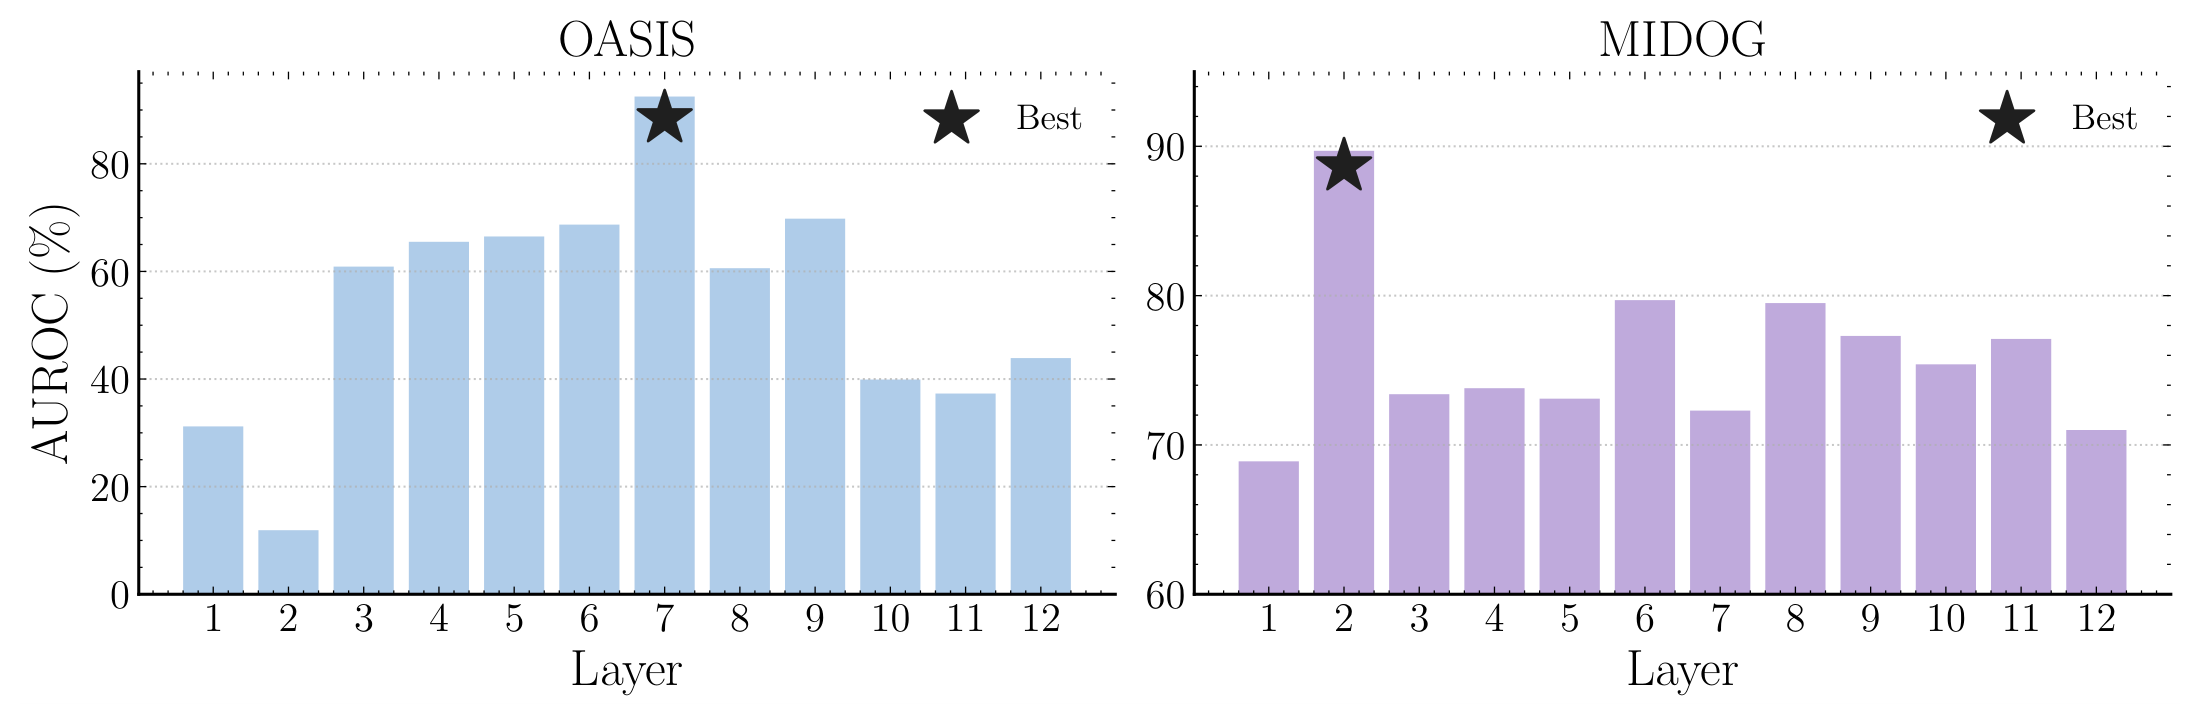
Figure 1. Layer-wise zero-shot OOD detection performance (AUROC, %), using UniMedCLIP. Left: OASIS (brain MRI). Right: MIDOG (histopathology). Each bar corresponds to the OOD detection performance using Maximum Concept Matching (MCM) for the corresponding encoder layer, averaging for both near- and far-OOD shifts. The best layer depends on the imaging modality, and the final layer does not exhibit the best performance in either case.
VLMs learn a shared embedding space for images and text through contrastive pretraining. We consider CLIP-style models with an image encoder $E:\mathcal{I}\rightarrow\mathbb{R}^{d}$ and a text encoder $T:\mathcal{P}\rightarrow\mathbb{R}^{d}$. Given prompts $\{P^{1},\dots,P^{M}\}$, the softmax similarity between an input image $I$ and prompt $P^{j}$ is
$$ p(y^{j}\mid I)=\frac{\exp\!\big(\cos(E(I),T(P^{j}))/\tau\big)}{\sum_{m=1}^{M}\exp\!\big(\cos(E(I),T(P^{m}))/\tau\big)}. $$
Maximum Concept Matching (MCM) defines the OOD scoring function as $S_{\text{MCM}}(I)=\max_{j}\,p(y^{j}\mid I)$; an input is in-distribution if $S_{\text{MCM}}(I)\geq\theta$ and OOD otherwise. The visual encoder produces intermediate representations $\{L_{j}(I)\}_{j=1}^{N}$, each projected into the shared image–text space via the same pretrained projection head so that a layer-wise MCM score $S_{\text{MCM}}^{(j)}(I)$ can be computed at every depth.
Multi-resolution entropy estimation. We evaluate all candidate layer subsets while enforcing inclusion of the final layer, $\mathcal{C}=\{N\}\cup\mathcal{C}'$ with $\mathcal{C}'\subseteq\{1,\dots,N-1\}$. For a subset $\mathcal{C}$ we collect the aggregated score distribution over the in-distribution images,
$$ S_{\mathcal{C}}=\left\{\tfrac{1}{|\mathcal{C}|}\sum_{j\in\mathcal{C}}S_{\text{MCM}}^{(j)}(I)\right\}_{\forall I\in\mathcal{I}_{\text{ID}}}. $$
To obtain a robust uncertainty measure, entropy is computed across an ensemble of histograms $\{B_{k}\}_{k=1}^{K}$ with $K$ binning scales and then averaged across resolutions,
$$ H_{k}(S_{\mathcal{C}})=-\sum_{b=1}^{B_{k}} p_{b}^{(k)}\log p_{b}^{(k)}, \qquad \bar{H}(S_{\mathcal{C}})=\frac{1}{K}\sum_{k=1}^{K}H_{k}(S_{\mathcal{C}}). $$
The optimal layer subset is $\mathcal{C}^{*}=\arg\min_{\mathcal{C}}\bar{H}(S_{\mathcal{C}})$. It is determined once on the ID set and remains fixed for every test sample. Averaging entropy across histogram resolutions (we use bin sizes $\{4,8,16,32,64\}$) substantially reduces bin-size sensitivity compared to single-resolution estimation.
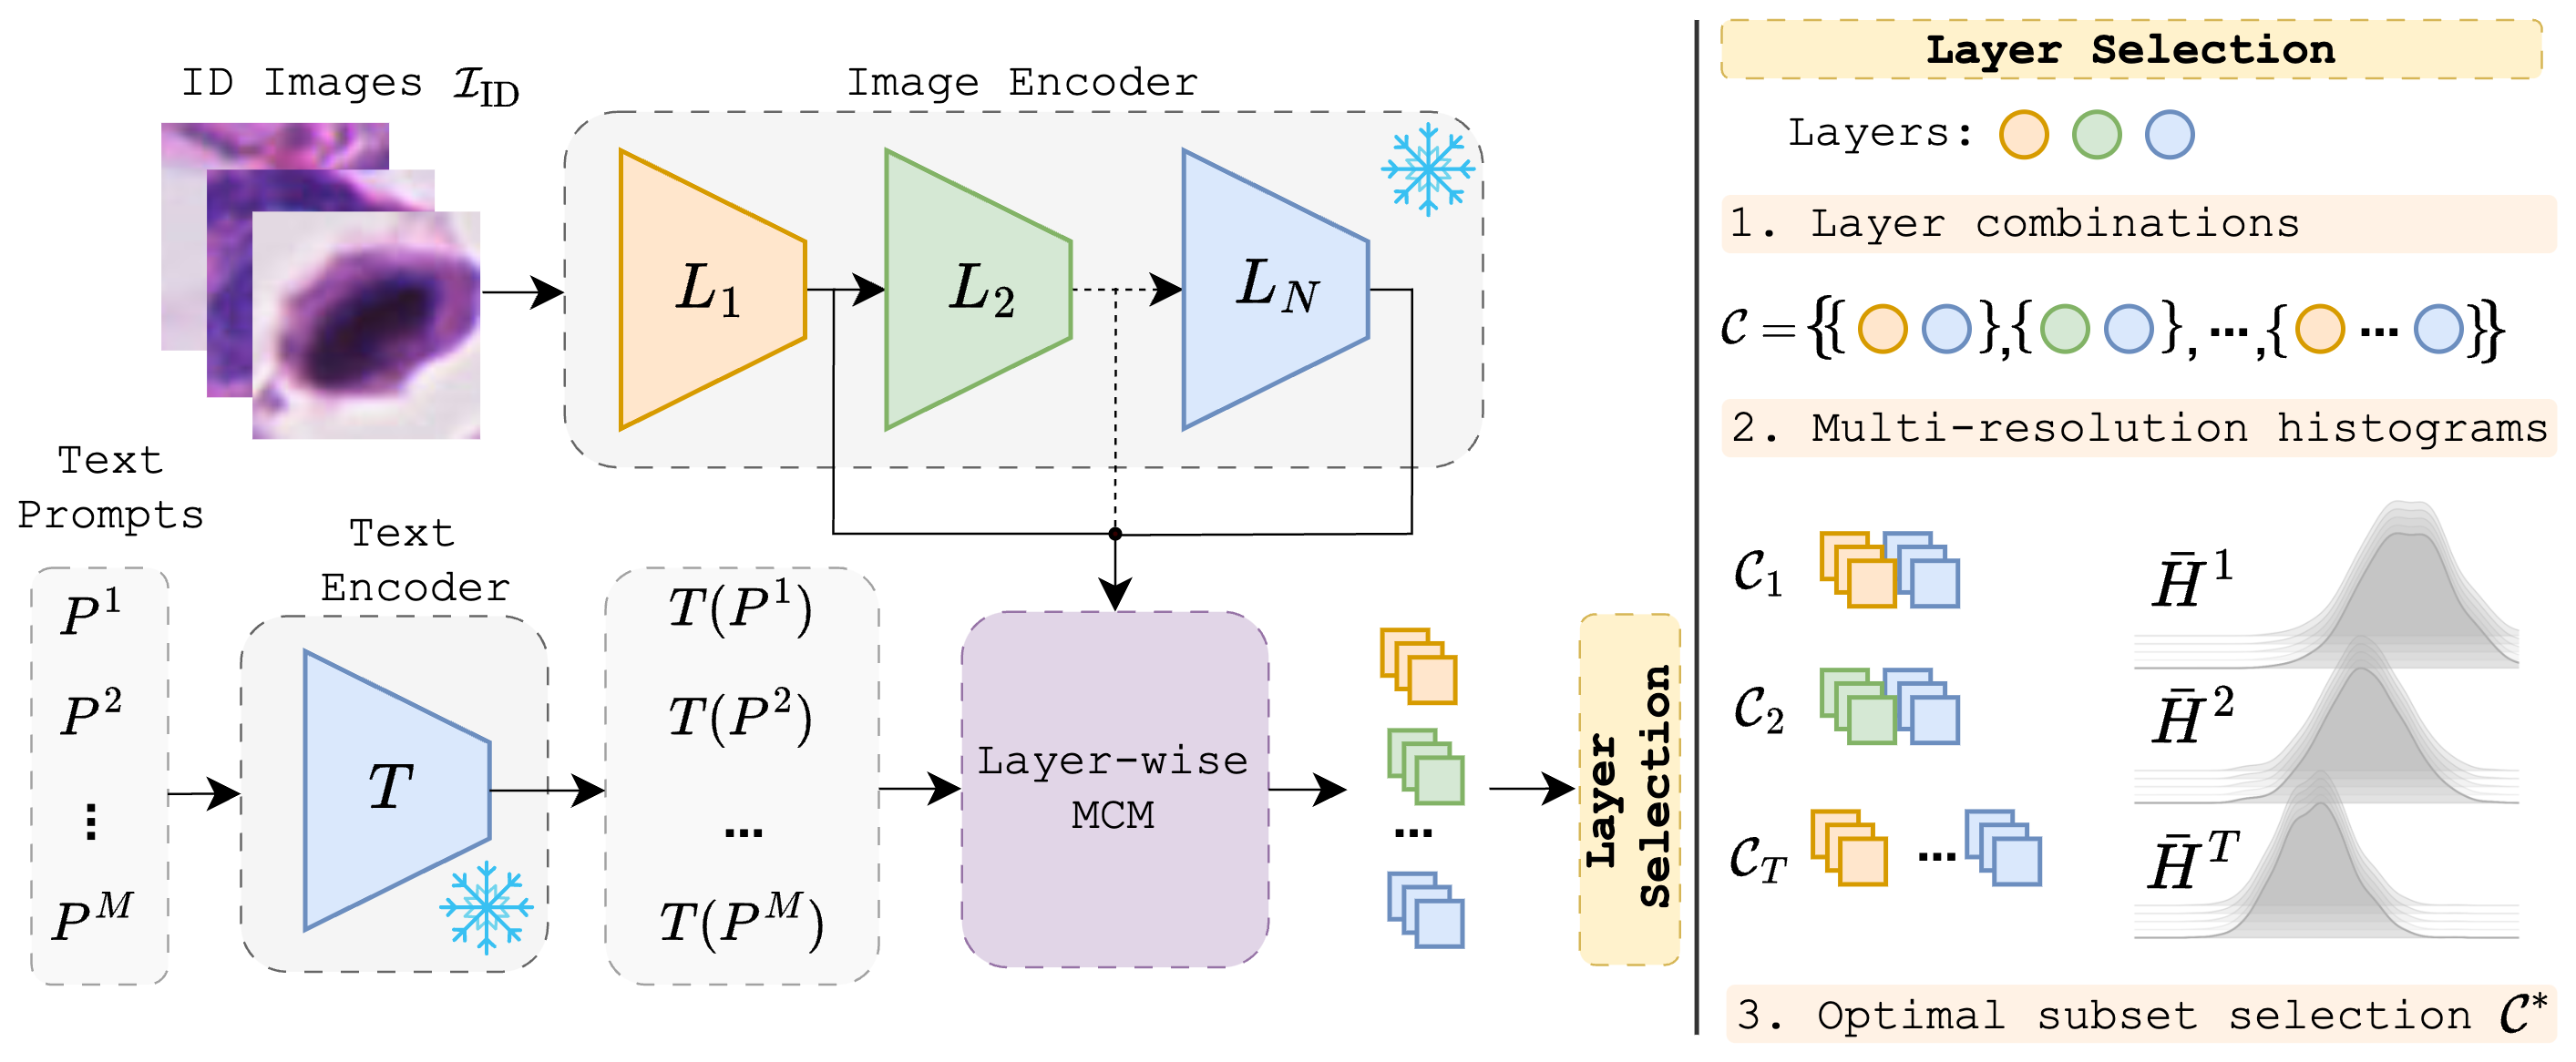
Figure 2. Overview of the proposed intermediate-layer selection framework. Given in-distribution images $I\in\mathcal{I}_{\text{ID}}$ and prompts $\{P^{1},\dots,P^{M}\}$, the visual encoder outputs intermediate representations that are projected into the shared image–text space and scored via layer-wise MCM. Candidate layer subsets $\mathcal{C}$, always including the final layer $N$, are constructed and their aggregated scores collected to form the subset score distribution $S_{\mathcal{C}}$. This distribution is evaluated via multi-resolution entropy $\bar{H}(S_{\mathcal{C}})$, and the optimal subset $\mathcal{C}^{*}$ minimizing aggregated entropy is selected for test-time inference.
We evaluate two CLIP-based medical VLMs: UniMedCLIP and BioMedCLIP on the MIDOG (histopathology) and OASIS (brain MRI) benchmarks, each under near- and far-OOD settings, and report AUROC ($\uparrow$) and FPR95 ($\downarrow$). On OASIS, our method achieves near-perfect performance across both settings and backbones. The largest gains appear in FPR95: on BioMedCLIP our method reduces FPR95 by roughly 20% in both near- and far-OOD compared to the strongest baseline. On MIDOG with UniMedCLIP, our method attains the best overall results, and overall UniMedCLIP emerges as the more reliable backbone for OOD detection in this evaluation.
| UniMedCLIP | BioMedCLIP | |||||||
|---|---|---|---|---|---|---|---|---|
| Near-OOD | Far-OOD | Near-OOD | Far-OOD | |||||
| AUROC ↑ | FPR95 ↓ | AUROC ↑ | FPR95 ↓ | AUROC ↑ | FPR95 ↓ | AUROC ↑ | FPR95 ↓ | |
| MIDOG | ||||||||
| MCM [18] | 50.5 | 94.5 | 84.3 | 49.3 | 52.7 | 95.6 | 46.3 | 99.1 |
| Ju et al. [12] | 40.5 | 98.0 | 37.4 | 99.7 | 50.2 | 97.4 | 84.8 | 66.0 |
| De la Jara et al. [10] | 29.1 | 99.7 | 97.1 | 16.6 | 32.1 | 97.3 | 99.8 | 1.3 |
| Ours | 54.6 | 94.4 | 97.4 | 13.4 | 36.4 | 100.0 | 99.5 | 2.7 |
| OASIS | ||||||||
| MCM [18] | 55.2 | 99.9 | 8.6 | 100.0 | 90.4 | 34.8 | 49.0 | 99.9 |
| Ju et al. [12] | 25.3 | 100.0 | 27.0 | 99.2 | 85.7 | 34.8 | 92.9 | 20.4 |
| De la Jara et al. [10] | 100.0 | 0.0 | 97.7 | 6.5 | 50.0 | 78.5 | 60.7 | 39.3 |
| Ours | 100.0 | 0.0 | 99.2 | 1.0 | 97.3 | 14.3 | 100.0 | 0.0 |
Table 1. OOD detection results (AUROC ↑, FPR95 ↓) across two backbones (UniMedCLIP and BioMedCLIP) and two datasets (MIDOG and OASIS), each evaluated under near- and far-OOD settings. Best result per column in bold. Despite some variability on BioMedCLIP for MIDOG, our method consistently achieves strong performance and substantially outperforms reference approaches across most configurations.
Number of selected layers. Starting from the final layer alone, we progressively add intermediate layers selected by our entropy criterion. For UniMedCLIP, aggregating more intermediate representations consistently improves OOD detection above the last-layer baseline; for BioMedCLIP, accuracy eventually decreases as more layers are added — confirming that layer selection is beneficial and that OOD-relevant signals are distributed across layers rather than confined to the final one.
Sensitivity to histogram bins. Following prior work, we implement a single-resolution entropy baseline and sweep bin counts $\{4,8,16,32,64\}$ on OASIS (near). Performance varies substantially across bin sizes (standard deviation $\sigma = 8.2\%$) with a maximum drop of 19.3%, highlighting the fragility of single-resolution entropy estimation. In contrast, our multi-resolution ensemble-of-histograms achieves stable, near-optimal performance without requiring manual bin-size selection.
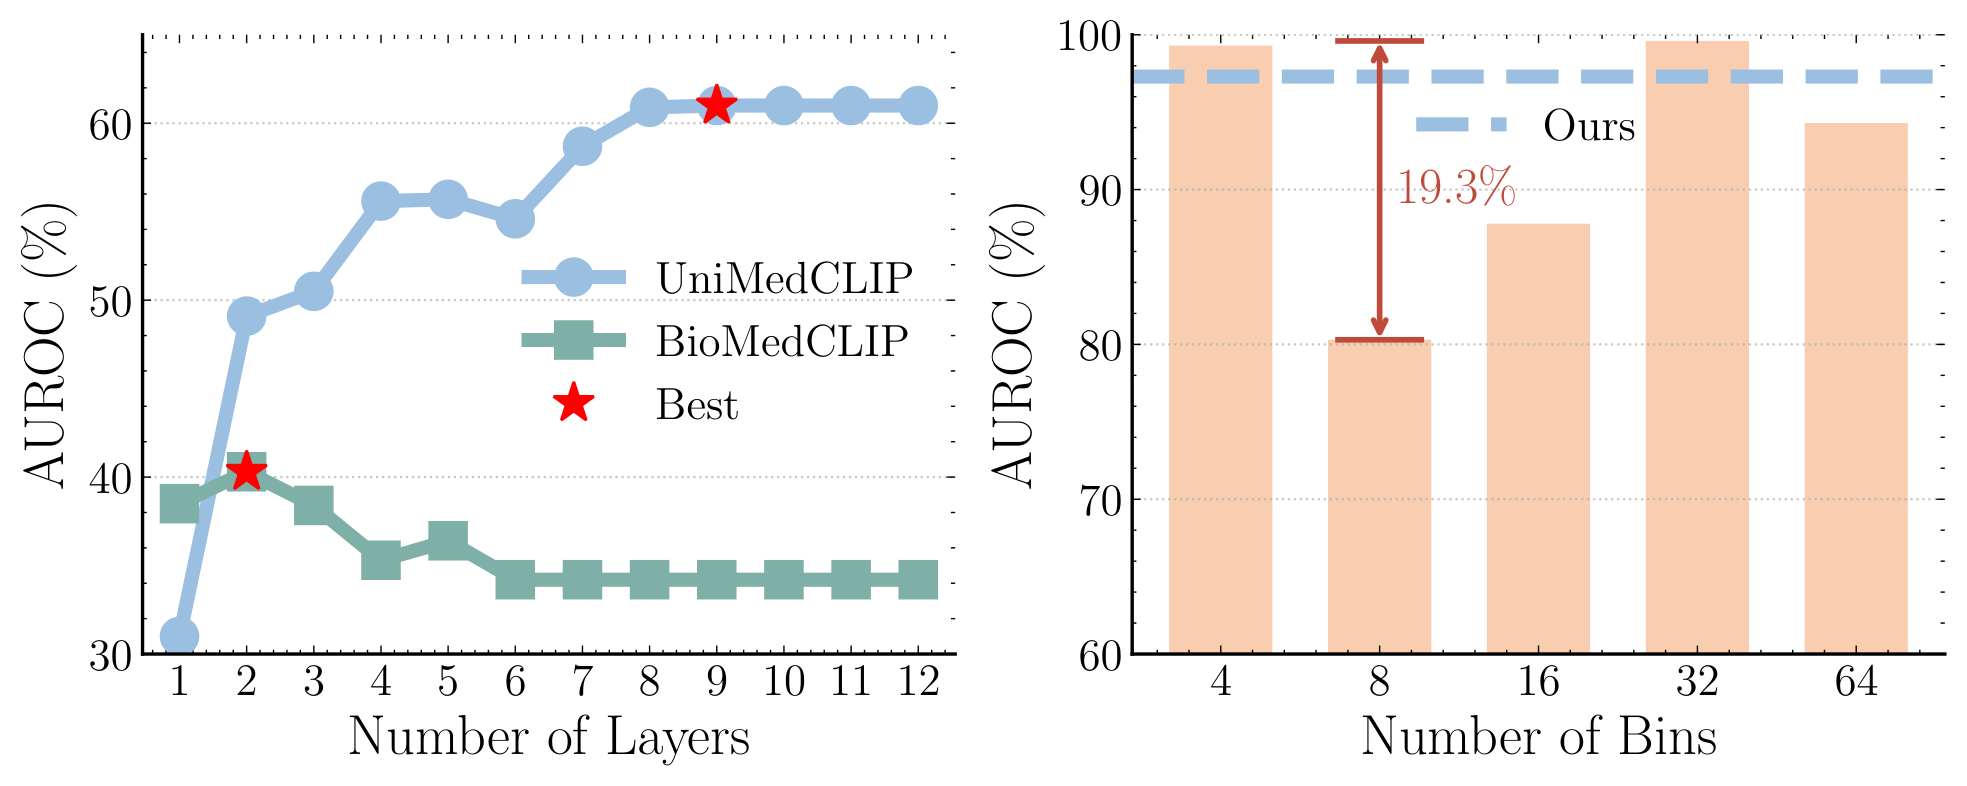
Figure 3. Left: OOD performance on MIDOG (near) as a function of the number of aggregated intermediate layers. Right: sensitivity analysis on OASIS (near) of single-resolution entropy-based layer selection across different histogram bin sizes, where performance varies by up to 19.3%. Our multi-resolution entropy estimation strategy achieves stable and near-optimal performance (dashed line, Ours).